
Texture Analyser troubleshooting
Having problems with your Texture Analyser? Most issues can be resolved quickly with a few simple checks.
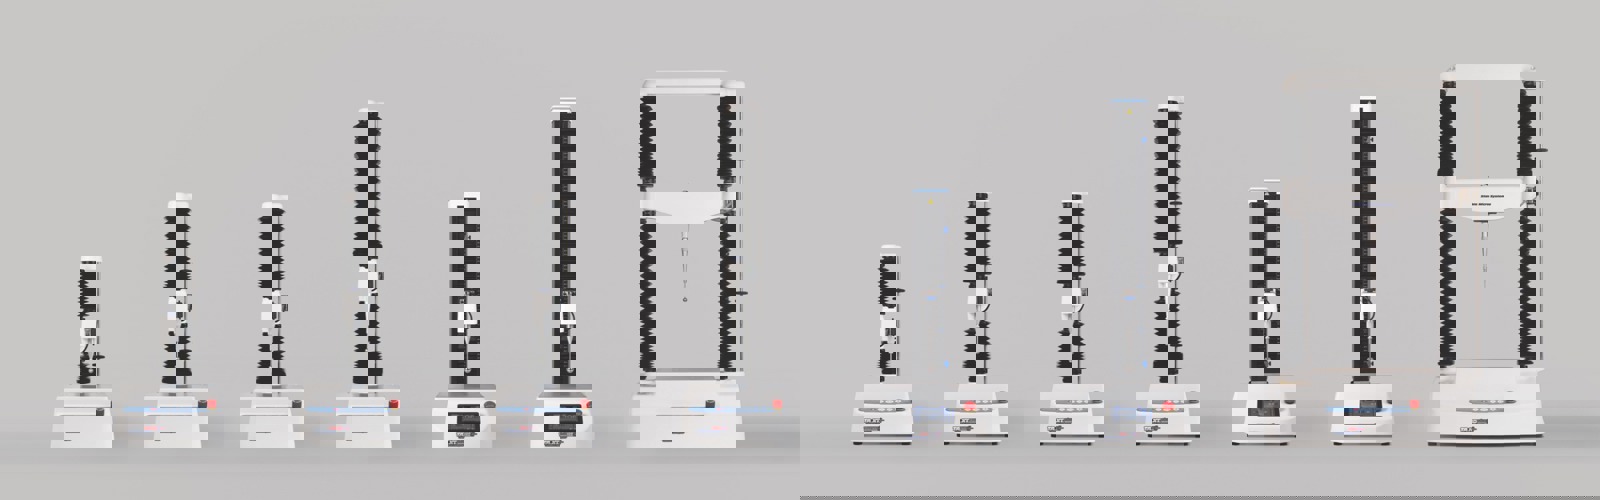
How to check your Texture Analyser
Quick checks on the instrument
Start here. These five checks resolve a large proportion of issues before you even open the software.
Make sure all cables are correctly fitted and securely connected to the right ports on both the Texture Analyser and the PC.

Inspect each connector for bent, missing or damaged pins. Replace any cable that shows signs of damage. Always use the cables supplied by Stable Micro Systems; third-party cables can cause communication faults. Connections should only be changed when the power is switched off to prevent damage to the equipment.
Tip: if you have an external USB adapter, confirm it is a Stable Micro Systems adapter and not a third-party one.

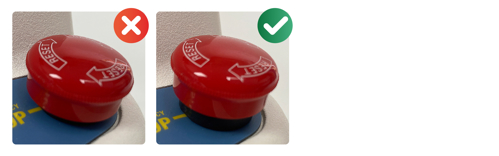
If the red Emergency Stop button on the front of the instrument is pressed in, the Texture Analyser will not power on or run. Twist the button in the direction of the arrows to release it.
The power light on the front keypad confirms the instrument is receiving mains power. If it is not lit, check the mains cable, wall socket and the on/off switch at the back of the instrument. On Texture Analysers with an external keyboard or control panel, an illuminated screen will confirm power is connected.
Note: there is no power light on TA.XT icon or very early TA.XTExpressC instruments.

A Load Cell that is not centrally located may foul the inside of the Load Cell carrier and produce unexpected force readings. To check this:
1. Run a basic Return to Start test with no probe or fixture fitted.
2. During the test, manually press onto the Load Cell and watch the curve on the screen.
3. Check that the force returns to zero when you remove the applied force.
If the force does not return to zero, reinstall your Load Cell, ensuring the locating post is used for correct centralisation.
Always switch the Texture Analyser off before removing or fitting Load Cells. Failure to do so may damage the Load Cell circuitry.
Fitting the interchangeable Load Cell
This procedure assumes that the standard Load Cell has been removed from the instrument.
- Position the interchangeable Load Cell into the Load Cell carrier, ensuring that the removable location peg fits into the calibration platform aperture. (For TA.XTplus100C models this location peg needs to be attached once the Load Cell is inside the carrier. Load Cells of 100kg capacity require the use of the Torque Wrench – included with 100kg Load Cells. For optimum repeatability of test results, tighten up the Load Cell screws to 8Nm.)
- Secure the Load Cell with the 2 hex headed screws. Tighten these screws with the ball-ended screwdriver provided to ensure a correct fit then fully tighten the screws using the short end of the 5mm Allen key provided.
- Unscrew the location peg now protruding through the calibration platform aperture. Fit the calibration platform in its place and tighten the hex headed screw. Keep the location peg with the Load Cell previously removed, ready for further use.
 Fitting the interchangeable Load Cell with standard connector
 Fitting the interchangeable Load Cell with D-Type connector
Connect the 15-pin plug to its port on the carrier arm stop box, and tighten the screws with the electrical screwdriver provided.
Depending on the Load Cell type the adapter block may need to be removed (for installation into TA.XTplusC or TA.XTExpressC models or added (for installation into TA.XTplus100C models).
S-Beam Load Cell fitting and removal from a TA.HDplusC Texture Analyser
(For 50kg, 100kg, 250kg, 500kg, 750kg S-Beam Load Cell)
Fitting the interchangeable S-Beam Load Cell
 Diagram illustrating how to fit the interchangeable S-Beam Load Cell.
- Position the interchangeable Load Cell into the Load Cell carrier.
- Secure the Load Cell with the hex headed bolt with washer, fully tightening them with the ring spanner provided with the kit.
- Connect the 9-pin plug to its port on the carrier arm stop box, and tighten the screws with the electrical screwdriver provided.
Fitting the interchangeable low force Load Cell (Model serial numbers 6000 and above)
(For 5kg, 10kg and 30kg Cantilever Load Cells)
This procedure assumes that the standard Load Cell has been removed from the instrument,
 Diagram illustrating how to fit the interchangeable low force Load Cell.
- Screw the spacer (if not already fitted) into the second threaded hole on the top the Load Cell, as indicated in the diagram.
- Position the Load cell into the Load Cell carrier, ensuring that the stepped section of the spacer locates correctly into the central hole.
- Secure the Load Cell with the two longer screws in the order indicated on the diagram, carefully tightening them with the screwdriver provided with the kit, ensuring that the spacer does not come into contact with the Load Cell carrier and is centrally positioned in the hole.
- Fit the third (shorter) screw through the calibration platform, locate through the central hole into the top of the Load Cell spacer, and tighten.
- Connect the 9-pin plug to its port on the carrier arm stop box, and tighten the screws with the electrical screwdriver provided.
Fitting the 500g low force Load Cell
 |
THIS LOAD CELL IS EXTREMELY FRAGILE – CARE SHOULD BE TAKEN TO AVOID DAMAGING THE CELL BY OVERTIGHTENING SCREWS OR PROBES WHEN FITTING. |
This procedure assumes that the standard Load Cell has been removed from the instrument.
- Important: Ensure that the Load Cell is correctly orientated, as shown in the diagram.
- Place the gold spacer, flanges down, onto the threaded post on the top of the 500g Load Cell.
- Position the Load Cell with spacer into the Load Cell carrier arm, ensuring that the threaded post passes
up through the large aperture. - Fit the large gold knurled disc onto Load Cell’s central threaded post. Tighten carefully until the Load Cell
is firmly in position. Do not over-tighten. - Connect the multi-pin plug to its port on the Load Cell carrier arm stop box, and tighten the screws, using
the screwdriver supplied if appropriate.
 Diagram illustrating how to fit the 500g low force Load Cell on TA.XTplusC and TA.XTExpressC Texture Analysers
 Diagram illustrating how to fit the 500g low force Load Cell on TA.HDplusC Texture Analyser
Configuring for interchangeable Load Cell
The Texture Analyser will automatically detect the new Load Cell and configure itself. Load Cell are factory calibrated to allow use immediately. To achieve optimum accuracy in your location, follow the User Calibration procedure.
Top and bottom limits prevent the arm from travelling beyond a safe range. If a limit is set incorrectly, the arm may stop unexpectedly or fail to start a test. Check that your limits are positioned to allow the full intended travel for your test, with appropriate clearance around your sample and fixture.


Note: Your software might display one of the following messages in the STATUS display in the lower right hand corner of the screen – TOPSTOP, BOTTOMSTOP.
Checks to perform with your software
Many issues are resolved by updating to the latest version of software. To find out what version of software you are running go to Help > About Exponent / Exponent Connect.
To update to the latest version of software:
- Go to the Software Updates section of our website
- Choose your software package.
- Download and install the latest version of your software.
The latest firmware is supplied with each software update. After installing new software, follow the firmware update procedure for your instrument:
• XT Connect range (TA.XTplusC, TA.HDplusC, TA.XTplus100C): use the Send File(s) to T.A. menu in Exponent Connect, or upload the update files via the web browser interface from an admin account.
• Earlier TA.XTplus, TA.HDplus and MT.LQplus instruments: run the TA.XTplus Initialiser program from the Exponent start menu, select the COM port, and reprogram the Motor and Comms FLASH in turn.
• TA.XTExpress instruments: run TestApp.exe in the TAFirmware folder, select the COM port and re-FLASH using the XTExpress.sx file.
Important: do not switch off the instrument while firmware is being transferred. Doing so may corrupt the update.
How do I read the firmware information for my instrument?
In your software, click T.A. > Utilities > Get Firmware Information (or similar, depending on your software version). Make a note of the values shown; Technical Support will often ask for these.
A correctly calibrated Load Cell is essential for accurate results. To check the force calibration:
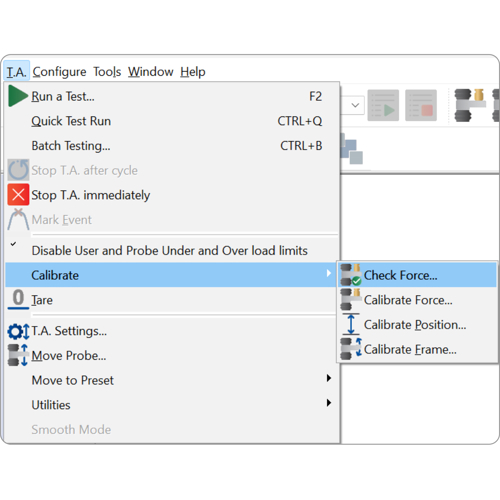
1. Click T.A. > Calibrate > Check Force (or use the Check Force icon).
2. Place a calibration weight of known value on the centre of the calibration platform or hanger.
3. Verify the reading is within specification. The standard (BS EN ISO 7500-1:2018) specification is 0.5% of the load applied. In practice, a typical result is better than 0.25% (e.g. a 5kg Load Cell should read better than +/- 12.5g).
4. Remove the weight and confirm the reading returns to zero.
If either the check weight reading or the return-to-zero check is outside specification, perform a full force calibration via T.A. > Calibrate > Calibrate Force.
The STATUS display in the lower right-hand corner of the software screen shows the current state of the instrument. The message you see is one of the most useful pieces of diagnostic information when contacting support. See the next section for what each status means.
Note: the STATUS display only applies to Exponent, Exponent Connect, Exponent Lite and Exponent Lite Express software.

|
Status |
What it means | What to do |
| Online | The software is communicating with the instrument and the instrument is ready. | No action needed; you can run a test. |
| Offline | The software cannot communicate with the instrument. | Check the cable connections, that the instrument is switched on, and that the correct COM port is selected in your software communications setup. |
| Underload | The Load Cell is reading a force below its specified range, often because the carrier or attachment is pressing upwards. | Stop the test and remove any source of upward force on the Load Cell. Check the probe or fixture is not catching on anything below. |
| Overload | The Load Cell is reading a force above its specified range. | Stop the test immediately. Reduce the applied force or fit a Load Cell of higher capacity if your test exceeds the current Load Cell rating. |
| Topstop | The arm has reached the upper limit of travel. | Move the arm down using the front keypad or software, then check that your top limit is set appropriately for the test. |
| Bottomstop | The main arm has reached the lower limit of travel. | Move the arm up using the front keypad or software, then check that your bottom limit is set appropriately for the test. |
| Cable fault | A communication fault has been detected on the cable between the Texture Analyser and the PC. | Check the curly cable for damage and that all connectors are seated correctly. Replace the cable if needed. See the curly cable test in the Plus instrument section below. |
Both messages mean the software cannot open a communications channel to the Texture Analyser. "Offline" indicates the port opened but the instrument did not respond; "Invalid port" indicates the COM port named in the software does not exist on the PC.
Work through the following in order:
- Check the instrument is switched on at the rear and that the power light on the front keypad is illuminated.
- Check the cable is seated at both the instrument and the PC, and that no connector pins are bent or missing.
- Check the Emergency Stop button is released.
Restart the PC and the instrument
Connection information held in memory can stop the PC matching your software to the correct connection. Clearing it resolves a large proportion of these faults and takes less time than any other check:
- Unplug the cable from the PC.
- Restart the instrument.
- Restart the PC.
- Open your software.
- Plug the cable back into the PC and try to connect again.
If using a serial cable:
- Open Device Manager in Windows and expand Ports (COM & LPT). Note the COM port number assigned to the Stable Micro Systems device.
- In your software, open the communications setup and select that COM port.
- Restart the instrument and the software, then try again.
If the port number changes each time the instrument is connected, use the same USB socket on the PC every time, ideally one on the motherboard rather than a hub.
If using a USB cable then:
- Open Device Manager and expand Universal Serial Bus controllers. Look for an entry for your instrument – the name varies depending on the model.
- In your software, open the Communications Setup and check that USB or a valid connection is selected.
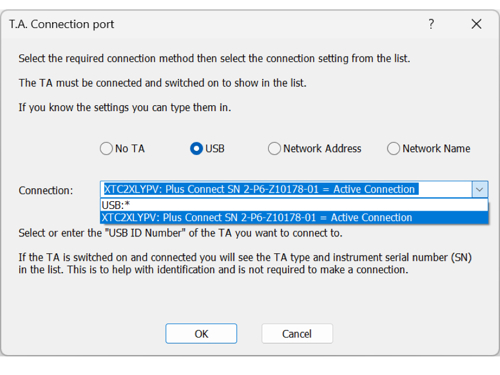
If no entry appears in Device Manager for your instrument, under either Ports or Universal Serial Bus controllers, there is a fault with the cable or the instrument. See Still need help?
If an entry appears but your software still cannot connect, the USB driver may not have installed correctly. Our USB driver reinstall guide takes you through removing the existing driver and reinstalling the one supplied with your software.
Download the USB driver reinstall guide (PDF)
Common test problems and answers – All Texture Analyser models
The most common cause is a trigger force that is set too high for the product, so the instrument cannot detect contact within its sensitivity. Reduce the trigger force in your project settings.

- Confirm the trigger type is set to Auto, not Button.
- Check the trigger force is not set lower than 5g when a 30kg load cell is installed.
However, this is almost always caused by vibration triggering the test early. Common causes:
- Doors closing or being banged nearby
- Open windows or circulating fan allowing draughts or external vibration
- Bench being knocked or shared with other equipment
- Air conditioning or ventilation units close by
- Heavy probes amplifying small fluctuations through inertia
- Screws on the Load Cell plug are not tightened and therefore vibrate
Solutions: Place the Texture Analyser on a stable, level bench away from these sources. If the problem persists, slightly increase your trigger force.
Most often, the Load Cell is not centrally located in its carrier. Reinstall the Load Cell using the locating post for correct centralisation. After reinstalling, check the force calibration and run the basic Return to Start test described in check 4 above.
A damaged curly cable can produce the same symptom. This is the black coiled cable running between the arm and the base at the rear of the instrument. Wear over many years, or accidental damage, can fray the wires inside so that signals cross between conductors. The instrument interprets these as force readings, which produces forces that do not match expectation and intermittent underload or overload conditions. A typical curve looks like this:

To confirm, see How do I check the curly cable? If the cable is faulty, contact your distributor to arrange replacement.
In tests such as back extrusion on semi-solid samples, the product may remain on the probe after the test ends.

The residual force is the weight of the sample stuck to the probe and is normal. If you are not testing a sticky sample and the force still does not return to zero, check that the Load Cell is correctly installed and the calibration is current.
If the product recovers faster than the probe withdraws, you will not capture the separation force. Increase your post-test (return) speed so the probe moves away from the sample faster than the sample can recover.

The most common cause is using a Load Cell capacity that is too high for the force you are measuring. Just as you would not weigh 10g on a 30kg balance, you should match the Load Cell to the expected force range of your test. Switch to a lower-capacity Load Cell where appropriate. Other causes include vibration (see above) and loose connections.

This typically indicates the arm is at a top or bottom limit, or the Emergency Stop button is engaged. Check the limit positions and that the Emergency Stop is released. If the buzz continues with no obvious cause, contact Technical Support.
This fault presents in one of two ways: a button does not respond when pressed, or a button is stuck down, in which case the instrument may move without any button being pressed.
To confirm, go to T.A. > Utilities > Input Monitor.
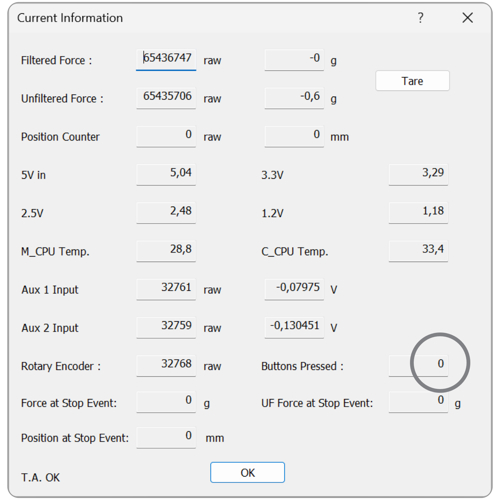
With no button pressed, the value shown should be zero. Pressing any key on the keypad should display a corresponding letter or number, and each key should return a unique value.
If the value is not zero with no button pressed, or a key returns nothing, the keypad membrane has failed. Contact your distributor to discuss replacement or further diagnosis.
Software related FAQs
Current versions of Exponent Connect and Exponent Connect Lite are compatible with Windows 11.
When moving to a new PC, install the latest version of the software on the new machine rather than copying the existing installation across. Contact Technical Support if you need a licence transfer.

This usually relates to whether the X-axis is showing distance from start of test or distance from a specific reference point, and whether positive distance is "down into" or "away from" the sample. Check your graph preferences and the test mode (compression versus tension) to confirm the axis is configured as expected.
Either the Distance Relative setting or the Inverted Graph option is incorrect.
There are two ways to change these settings:
- Right-click on the units displayed on the graph axis. The options appear at the bottom of the pop-up list that appears. Click on an option to toggle the status.
- Open the Graph Preferences (File > Preferences > User > Graph menu item, or press the F3 key). Change the options for the required data type.
First of all, a brief explanation of both trigger types:
Button: Measurement starts as soon as the Run command is given and the probe starts moving.
Auto: The Texture Analyser will move the probe up (Tension test) or down (Compression test) until it detects a force greater than the Trigger Force setting. Measurement starts once this force point is reached. This ensures that products of different sizes are accounted for. This facility also allows the Texture Analyser to measure the product height (particularly important when measuring in strain). Sometimes you can experience false triggering when using the Auto option. If this is the case then try increasing the Trigger Force setting.
Most products should be tested with an automatic trigger for detecting the surface of the sample and starting to collect the test data. The penetration, cutting or compression distances etc. are then identical for all automatic trigger tests without regard to the precise height and geometry of each sample tested.
The sensitivity of the automatic trigger can also be used to adjust for minor differences in sample geometry and sample preparation. For example, if you used a 3g trigger force for a product with an irregular surface you would almost certainly get relatively extreme differences in the depth of penetration, based on how deep the surface irregularities were. If the surface irregularities were from peaks like those on whipped cream, you could negate the surface irregularity impact by using e.g. a 25g trigger force, so the light surface peaks would be ignored, and the penetration distance would start at a more consistent product surface, i.e. when the probe and product surface have full contact.
The sensitivity of the automatic trigger can also adjust for differences in probes. For example, if you used a 3g trigger with a 3mm ⌀ Cylinder Probe the Texture Analyser may not detect the surface of a very soft gel until the probe is 4-5mm into the gel. Perhaps much better consistency between hard, soft and very soft gels could be attained by using a much lighter trigger force, or even a button test where the probe can be more precisely positioned over the sample by eye (or preset positions). Of course, using a different probe would also be suggested for gels.
Button tests are particularly good for testing products where geometry is difficult to control. We also highly recommend a Button trigger type when using the Kramer Shear Cell and Ottawa Cell. These attachments are often used when testing products of differing heights such as compressing a portion of cereal flakes. In these instances you can program the probe to travel a fixed distance so that the product, whatever its original shape or height, is deformed to a consistent height or cut to a constant distance above the base. For example, if you calibrate a probe to 10.0mm over the base, and then use a button trigger with a Return to Start test to travel 9.0mm, you will always deform or cut the product to a 1mm distance from the base.
The minimum trigger force depends on your Load Cell capacity, the probe weight and your testing environment. As a general guide, the trigger force should be high enough to avoid false triggering from vibration but low enough to register genuine sample contact. For most food applications a trigger of 5g to 20g works well. Heavier probes and noisier environments need higher trigger forces.
Release notes are supplied with each software update and are listed on the Version History page, linked from the Software Update page for your software. They cover new features, fixes and any changes that affect existing projects.
The same information is installed with the software as updateinfo.rtf in the application directory. The installer offers to open it at the end of installation, and you can open it at any time in Notepad.
Most pop-up boxes and toolbars in Exponent Connect are customisable. Right-click on a toolbar to choose which icons appear, and use the workspace feature to save the layout you prefer.
The Plug-in Manager can also be used to hide Test Parameters such as Product Height, etc., Axis types such as Pressure, etc., and Calculations such as Area, etc.
To run the Plug-in Manager, select from the Windows taskbar Start > Programs > Texture Exponent 32 > Plug In Manager. The folders can be expanded to show more folder / items. The items in the list are active when the is an tick in front of them. Click on the the tick to toggle the status.
- Items with a Graph picture represent axis types.
- Items with a Sum picture represent calculations.
- Items with a abc picture represent parameters.
- Items with Binoculars picture represent goto functions.
Click on OK to save the changes and close the Plug-in Manager. Changes will take effect when you next start Exponent Connect.
A workspace stores the position, size and content of every window in the software. Saving a workspace lets you restore the same view in one click, which saves time when switching between different tests or analyses. Workspaces are optional.
Set the windows up as you want them, then save the arrangement as a workspace. Load that workspace the next time you start the software to restore the layout.
Save your preferred window arrangement as a workspace, then load it at the start of a session. See What is a Workspace and why do I need one?
Double-click the title bar of a floating window to re-dock it, or drag it to the edge of the parent window to dock it on that side. Save the result as a workspace so the arrangement is not lost again.
Use the Graph window's menu item Results > Clear for Current Graph or Clear for All Graphs.
Right-click on any toolbar and choose Customise. You can add, remove or rearrange icons, and create new toolbars for your most-used commands.
A macro taken from a sample project, or sent by another Texture Analyser user, will often need adjustment before it runs correctly on your system.
To find the fault, arrange the Exponent window using Window > Tile Vertical, then step through the macro one line at a time using the Step button. This shows exactly where the macro departs from what you expect.
The most common faults are anchors dropped in the wrong position and the cursor sent to a force value that does not exist on the curve. Both are quick to see and correct when stepping line by line.
Changing the graph axes while stepping through helps to visualise what happens during the test and what data is being collected. Switching axis units – particularly between relative and absolute distance – adds further detail.

Yes. The software can be installed on multiple PCs owned by the registered company, using the codes obtained when registering the instrument and software.
Use the Exponent Backup and Restore utility to save your projects, macros, user profiles and settings. Store backups on a network drive or other external location so they survive a PC failure.
Close Exponent before you begin. You need administrator rights on the PC.
To back up
- Go to Programs > Exponent > Utilities and select Exponent Backup and Restore. If Windows asks whether the program may make changes, select Yes so it runs with administrator rights.
- Select the Backup option.
- For a full system backup, tick both Data boxes.
- Specify where the backup is to be stored.
- Click OK. A message confirms whether the backup was successful.
To restore
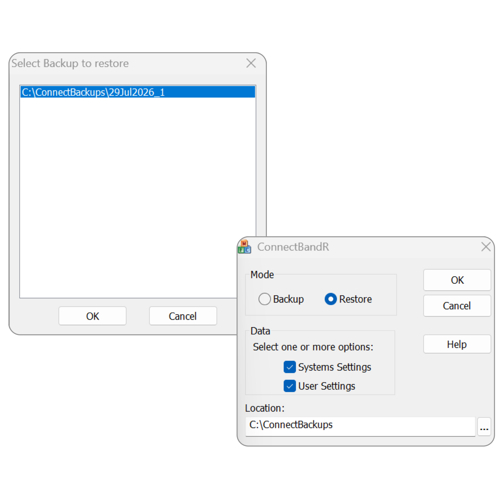
- Open the same utility and select the Restore option.
- Point the location field at the folder used for the backup.
- Click OK, select the required backup from the list, and click OK again. A message confirms whether the restore was successful.
Backup and Restore is also the best way to give several installations identical user and security settings, which matters when opening protected files across more than one PC.
The utility accepts command line parameters if you want to automate backups. See its Help file for the syntax.
Every test run in Exponent is recorded in the Test History database, whether or not the file itself still exists. Go to File > Recent Files > View Test History.
The database lists file names, batch names and file paths, and flags any file it can no longer find as missing. Sort by file name, date or path in either direction to locate what you need, and double-click an .arc file to open it in Exponent.
The same record serves as an audit trail of every test run on the instrument and the operator who ran it.
General Technical FAQS
Check the force calibration before any critical measurement, after the instrument has been moved, and at intervals appropriate to your quality system – typically daily, weekly or monthly depending on use.
Run a full calibration whenever a check force result falls outside specification, after a Load Cell change, and following any overload event.
Where several people share an instrument, each may have calibrated it around the force range they were working in. Recalibrate with your own calibration weight before starting your work.
Match the acquisition rate to the speed and detail of your test.
- Slow, smooth tests: 200 points per second (pps) is usually sufficient. Use lower rates only for long tests – below 200pps you risk missing genuine detail in the sample response.
- Fast tests, brittle fracture and event detection: 500pps to 2000pps. Higher rates capture short events such as the fracture peaks of crisp or brittle samples, and the separation events in an adhesion test, at the cost of larger files.
Within the software, click on T.A. > Calibration > Check Force. Place known weights on the calibration platform to check the reading in this window. The weight value placed on the calibration platform should be that displayed in the box of this window.
Texture Analyser Load Cells are factory calibrated at full capacity at our Godalming facility. A user calibration often gives more accurate results in your own laboratory because it removes the small variation in gravity between the two sites. Calibrate around the force range you most often measure to get the best accuracy in that range. The reference standard is BS EN ISO 7500-1:2018.
Points to note when calibrating:
- Do not lift the calibration weight off the platform until the software prompts you to.
- Do not use a calibration weight of less than 10% of the force capacity you intend to work up to.
- An overload or underload event does not affect the force calibration, but calibration is quick and is worth repeating afterwards in any case.
- An overload or underload event does lose the probe height calibration. Repeat that calibration if your test procedure requires it.
No. Probe height calibration is only required when testing samples to a specified strain, or when using a Button trigger.
It is also useful if you want to set preset positions on the instrument – for example a loading position and a start position just above the sample – to reduce cycle time when testing multiple samples.
Getting TPA results right depends more on test set-up than on the calculation itself. Before you rely on the results, check that you have:
- A compression probe larger than the sample, so the forces measured come from compression rather than puncture
- Consistent deformation (% strain) across samples, appropriate for what you are comparing
- Test speed and post-test speed matching, especially where cohesiveness needs to calculate correctly
For full guidance on correct set-up, common misuse and how to interpret each parameter, see our Texture Profile Analysis (TPA) page.
Your software includes a Help section covering test examples, procedures and guidance on developing well-optimised tests for your products.
In Exponent, go to Help > Education Zone for texture analysis background and method development guidance.

or Help > Powder Flow Analyser to see all of the advice we have to offer you.

Attachment related FAQs
Some probes and attachments have common issues associated with their setup. A "blank" test using a Button trigger (with no sample in place) is a useful diagnostic for many of these.

Misalignment of the blade and blade guide will cause friction. A ‘Blank’ test is advised using a Button trigger to check for this.

Blades can be difficult to align in blade guides and slots. Check that friction is not being measured by performing a ‘Blank’ test using a Button trigger.

The Extrusion plate is often pushed in too far. Additionally, a misaligned plunger can cause friction with the cell walls. Check this by performing a ‘Blank’ test using a Button trigger.

If the rig is situated too far forward the hook touches the perspex top as it moves through. If the test starts with the hook touching the spring-loaded platform there will be a force offset created.

The upper and lower grips must be started at least 1mm apart. If the test starts with the grips touching a force offset will be created.

The cone probe must be perfectly aligned with the sample holder. Clamp the rig in the Heavy Duty Platform, move the probe down very slowly and move the Heavy Duty Platform around until the two cones are touching, then secure the Heavy Duty Platform.

Tape should be placed on the extrusion disk hole if a low viscosity sample is contained. Friction between the extrusion disk and cell wall should be almost negligible. A ‘blank’ test should be performed to check this.

If the force increases towards the target distance you may be nearing the base of the vessel and measuring a ‘base effect’. As a general rule, your extrusion distance should not exceed 80% of the depth of the sample. Likewise, a disc that is too large for the test vessel could create an artificially increased force due to ‘wall effects’.

Clamping the sample too tightly will squash the sample and potentially produce erroneous results. Clamping the sample too loosely means the sample will potentially be lifted upon probe withdrawal.
Choose a vessel deep enough that your deformation distance into the sample is no more than 80% of the sample depth, and a probe small enough relative to the vessel diameter to avoid wall effects (unless performing a back extrusion test).
Taring the sample weight incorrectly during a tensile test can create a force offset.
It is recommended to place the sample in the upper grip of whichever tensile rig you are using, and tare the force without the sample touching the bottom grip. To do this:
- Fit the sample into the upper grip only, leaving it clear of the lower grip.
- Go to T.A. > Tare to tare the force.
- Fit the sample into the lower grip.
- In TA Settings, set Trigger Type to Button and Tare Mode to Off.
- Run the test.
Sample related FAQs
Test a minimum of 3 samples, and preferably 4, to distinguish between samples with any confidence. Test 5 or more where sample repeatability is expected to be low – inherently variable products such as potato crisps are a common example.
Standard deviation and coefficient of variation are not statistically valid on a set of fewer than 4 samples, and should ideally be applied to sets of more than 5.
If you are unsure how many replicates your product needs, run a small pilot study and examine the standard deviation across replicates.
When a semi-solid product remains on the probe after the test, the residual force shown at the end of the curve is the weight of the stuck material. This is expected behaviour and does not indicate an instrument fault. Clean the probe between tests and consider whether your trigger force or test geometry can be adjusted to reduce sample carry-over.
Additional troubleshooting FAQs
A faulty curly cable can cause intermittent communication errors that are hard to diagnose. To test:
1. Set up a Hold Until Time test with distance set to 0, trigger type Button and test speed 10mm/s.
2. Start the test and gently wiggle the curly cable along its length while watching the force curve.
3. Any correlated changes in the force reading suggest the cable is faulty and should be replaced.
Note: The Texture Analyser may continue to move even with the curly cable disconnected, so movement alone does not rule out a cable fault.
Non-USB Plus instruments normally have both Power and Comms lights illuminated when idle. USB-capable Plus instruments have only the Power LED illuminated under idle conditions. If your lights do not match these patterns, check cables, USB drivers and software communications settings.
In Windows, open Device Manager, expand "Universal Serial Bus controllers" or "Ports", find the Stable Micro Systems device, right-click and choose Properties, then Driver. Note the driver version and date and supply this to Technical Support if asked.
The LED ring on top of the TA.XTplus100C uses four colours to show instrument status:
• Blue: instrument idle
• Yellow: test started
• Green: collecting data
• Red: error or stop condition (e.g. top/bottom limit, overload)
If the ring is set to "off" in System Settings it will only light up red for error conditions.
Live readings show the raw force values from the Load Cell and which keypad keys are being pressed. Use them to:
• Check the Load Cell is not damaged or bent (raw readings should be stable when nothing is touching the probe)
• Verify keypad membrane response (each key press should change the displayed key number)
• Get an indicative calibration check by placing a known weight on the platform and reading the apparent change
Still need help?
Stable Micro Systems distributors are trained to help with technical questions.
You can also contact our technical support team using our online technical support form.
Before Stable Micro Systems are able to assist in diagnosis of any Texture Analyser faults, you must update to the latest software and firmware version. If the issue is still unresolved, we will need to receive a test (.arc) file from the instrument and, if possible, a video showing the problem visually if it is not presented in the software.
To help us help you as quickly as possible, please have the following ready before you go to the technical support form:
- Which Texture Analyser model are you using (e.g. TA.XTplusC, TA.HDplusC, TA.XTExpressC, TA.XTplus100C, or earlier model)?
- Which software package are you using?
- What software package and version number are you running? (Click Help > About within the software.)
- What firmware version is your instrument running?
- What operating system are you using (e.g. Windows 11)?
- What probe/attachment do you have connected to the instrument?
- Do you have any additional devices connected to the instrument?
- The serial number of your instrument.


