Ceramscan Software
Analyse and understand your products – our software offers the most comprehensive set of features and data analysis tools for the measurement of ceramic density.


 1
1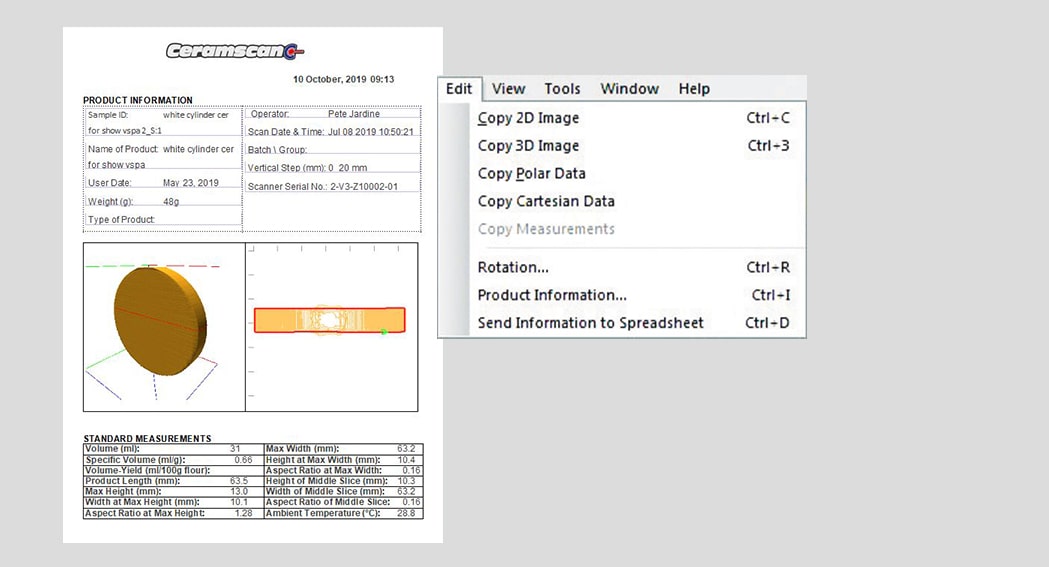 2
2World-class software
Like the capabilities of the instrument, you’ll want to make sure that the software is as feature-rich as possible for all of your future requirements, while being easy to use for both capturing, analysis and presentation of data.
Since the launch of the Volscan Profiler in 2008, our volume and density measurement software has continued to improve and develop and now powers the Ceramscan software.
Unique features
Software written and developed in-house and durability of software
Export of data in .stl format to allow import into popular CAD packages (maximum data size applies)
3D grab and spin viewing - rotatable in all planes with user-defined product colour
Automatic temperature measurement of chamber at start of each test
Volume verification possible
Language Editor – menu items and operator messages can be easily converted into your own language using a provided plug-in tool for language editing.
Full guide available in Help file format advising on optimum test settings and sample data
Data can be sorted by any column header and statistics adjusted according to new data selection
Data can be viewed in or exported to Excel
Multiple samples can be scanned within one test and then extracted individually
Results can be quickly emailed by clicking on the Mail To button which automatically opens up a message window in Outlook and attaches the active window
A Report template is available into which data can be dropped and automatically positioned or modified with full Report Editing tools and saved as a .pdf file Barcode scanner compatible
Data and images can be copied and pasted easily into other applications
Automatic software measurements and calculations available as standard
Product Density, Volume, Weight, Specific Volume, Length, Surface Area, Max Height, Width at Max Height, Aspect Ratio at Max. Height, Max Width, Height at Max. Width, Aspect Ratio at Max Width, Height of Middle Slice, Width of Middle Slice, Aspect Ratio of Middle Slice, Minimum Enclosing Circle, Max. Inclusive Square Volume, Trim Percentage, Circumference.
Free software updates for the life of your instrument
Unmatched continuously enhanced software comes as standard and updates are available to download free of charge from our website. Updates include any small bugs that are found, new features that have been suggested by our users and additional application notes written for your interest. Sign up to our newsletter and never miss an update.
Stable Micro Systems can guarantee that the Volscan Profiler software is operational in Windows operating systems from Version 10 onwards with Intel 32 bit or 64 bit Multicore CPU or AMD equivalent. This is important to consider as, when your laboratory computer goes down and a new one is installed, you’re likely to have a newer Windows operating system. We’re checking the future is fully-functional for you all of the time!
We're so sure of our products, we also offer complimentary technical support for the life of your instrument.
Data analysis, manipulation and viewing options
A comprehensive software capture and analysis package is included with every system.
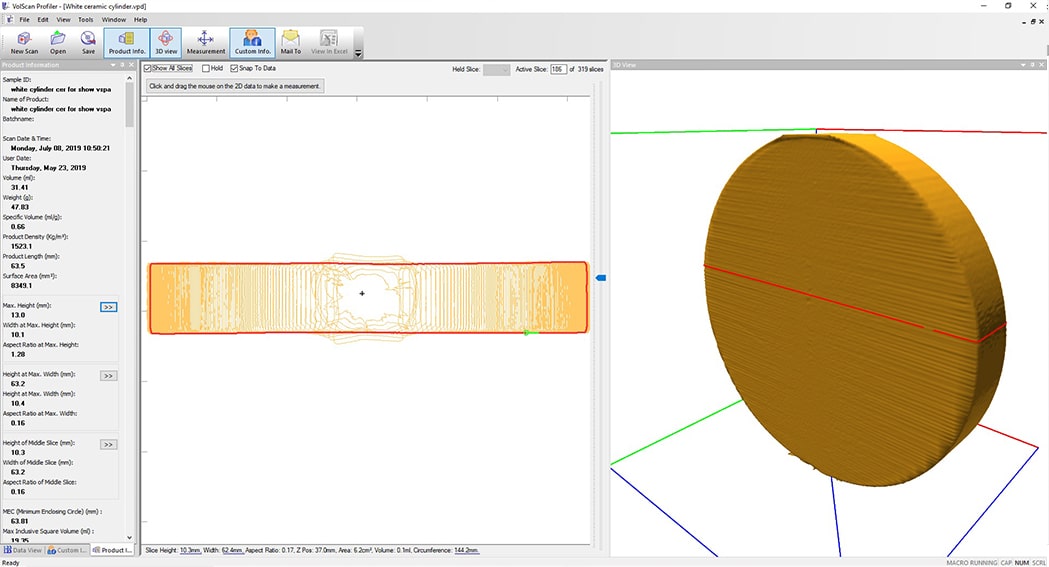
Once the test is complete a full set of dimensional measurements are quickly displayed (as shown above). The scanned data can be viewed in both 2D and 3D representations to allow comparisons with previous archived measurements or exported as .stl files for viewing in popular CAD packages. Within the 2D sectional view, additional automatic and manual measurements can be made on chosen intervals or 'slices' of the test data [2/3]. 3D views of the product are rotatable in all planes providing flexibility of viewing for visual comparison and presentation [4].


All data is saved in spreadsheet files for easy access and analysis [5]. This data can be viewed in or exported to Microsoft Excel.
Data can be sorted by any column header and statistics adjusted according to new data selection.

Results can be quickly emailed by clicking on the Mail To button [6] which automatically opens up a message window in Outlook and attaches the active window [7].
A Report template is available into which your data can be dropped and automatically positioned with test data fields or modified using full Report Editing tools and saved as a .pdf file [8].

Alternatively, images and data can be copied and pasted into other applications [9].


