How to measure cohesiveness

Cohesiveness: definition and importance
Cohesiveness refers to a material's ability to stick together or maintain its integrity when subjected to forces. It is determined by the internal attraction between molecules that hold the material together. High cohesiveness is desirable in certain products, such as paint, where clean separation from the main mass is necessary, while low cohesiveness can be favourable for products like honey, where extension from the mass is accepted.
In fields such as engineering, cohesive materials like ceramics, rocks, and cement must withstand forces without failing, making accurate measurement essential for predicting their performance. Soil cohesion, important for soil structure and consistency, is usually measured through an Unconfined Compressive Strength Test to ensure it maintains a balance between stability and friability. For pressure-sensitive adhesives, high cohesion indicates strong internal bonds, crucial for handling heavy loads without tearing.
In powder and granulated materials, cohesiveness can affect flow properties, which is measured using a Powder Flow Analyser.
Further example applications of cohesiveness testing
Cohesiveness measurement using a Texture Analyser evaluates a material’s ability to stick together under stress, particularly important in industries like food, pharmaceuticals, and cosmetics. Below are some specific applications:
- Food products: Assessing the cohesiveness of meat, bread, cheese, flavour cubes by measuring the force required to compress them and maintain their structure.
- Bakery products: Testing the cohesiveness of bread, cakes, or muffins by compressing slices to evaluate their integrity without crumbling.
- Snack foods: Measuring the force required to break chips or crackers and assess their tendency to shatter or remain cohesive.
- Pharmaceutical tablets: Ensuring tablets remain intact during handling by testing the force needed to break them without crumbling.
- Cosmetic products: Evaluating pressed powders and solid lipsticks by measuring compression force to ensure they remain cohesive without disintegrating.
- Chewable candy: Testing the force required to compress candies and assess their cohesiveness and tendency to either stick together or break apart.
- Gel-based products: Assessing hair gels or skincare formulations by measuring shear force to maintain their gel-like structure.
- Food pastes: Measuring the cohesiveness of peanut butter or chocolate spreads by testing the force needed to spread them without breaking apart.
- Adhesives: Testing construction adhesives by measuring the force required to separate bonded surfaces and assess internal cohesiveness.
- Dental products: Evaluating toothpaste or dental putty by measuring extrusion force to maintain product cohesiveness.
In these examples, a Texture Analyser applies controlled forces/distances to test materials, helping manufacturers understand and optimise product texture, quality, and performance in various industries.
Typical probe/attachment used for measurement
For the assessment of semi-solid/liquid samples
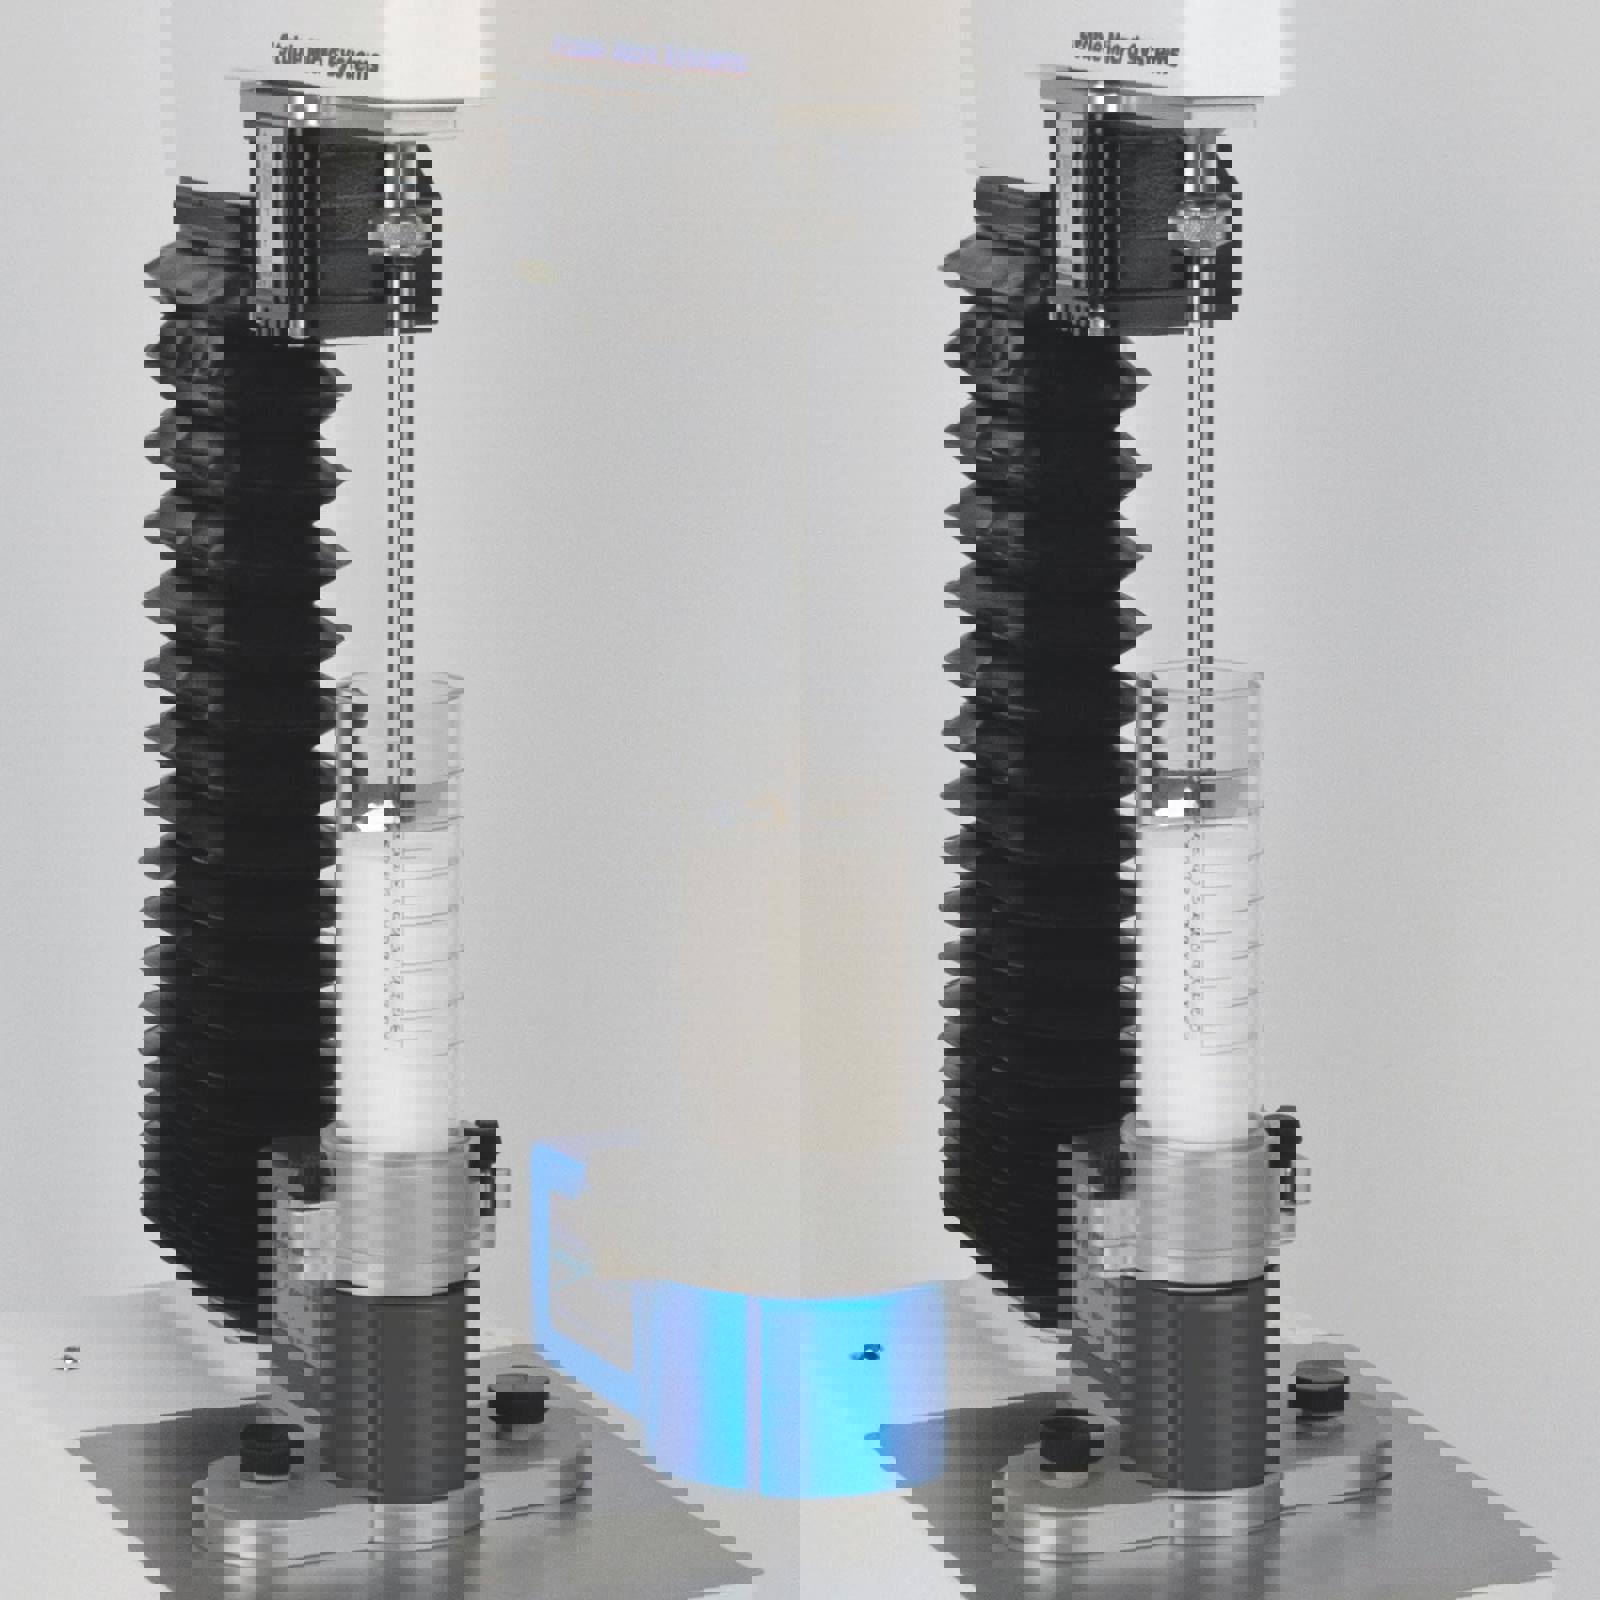
In a typical cohesiveness measurement test, a back extrusion or cylinder probe test is performed whereby the sample is placed in a cell/container and a central disc/plunger descends into the semi-solid/liquid. As the disc/plunger moves through the sample, it forces material to flow around it and up the sides of the cell/container and then withdraws from the sample during which the force required to move through the sample like this is measured. The cohesiveness of the sample is measured with respect to how the material tries to hold onto the disc and remain cohesive.
Imitative tests using the Back Extrusion Rig.


For the assessment of solid samples
A compression/penetration test using Compression Platens or Spherical Probes will measure the force to compress a sample and the failure within the sample during the test due to lack of cohesion.
Typical comparison of samples


How to interpret the Texture Analyser graph
Back extrusion – semi-solid/liquid samples
When measuring cohesiveness using a back extrusion test, the force vs distance or force vs time graph typically shows a smooth profile during sample flow if the sample is homogeneous and of a free-flowing, thick/creamy consistency. The presence of particulates of the breaking up of an e.g. gelled structure, during the test would present as undulations in the force profile as particulates are encountered by the probe’s movement or the structure is potentially broken down which would cause peaks and drops in force.
Compressing/penetrating solid samples
When measuring cohesiveness using a compression/penetration test, the force vs distance/time graph typically shows a profile of the point of product failure which indicates the degree of cohesion/strength that a product possesses to stay together or fail easily.
From the graph you can observe/obtain the following:
- Consistency
- Firmness
- Cohesiveness
- Tailing
- Stringiness
- Shortness
 Typical curve indicating key analysis points of a cohesiveness test of a semi-solid/liquid
 Typical curve indicating key analysis points of a cohesiveness test of a solid
A full explanation of this curve and its analysis can be accessed within Exponent Connect software. Existing Exponent users can upgrade to Exponent Connect specification.
Below is a video example of how we can help you understand curve analysis for an example property.
Key factors affecting cohesiveness measurement
- Temperature: The temperature of the sample can significantly influence its mechanical properties, affecting the measured cohesiveness.
- Humidity: Ambient humidity levels can alter the moisture content of samples, potentially changing their cohesive behaviour.
- Compression speed: The rate at which force is applied during the test can influence the measured results, as materials may respond differently to varying speeds of deformation.
- Deformation percentage: The degree of deformation applied to the sample during testing affects the measured cohesiveness.
- Sample size and shape: Consistency in sample dimensions is crucial for accurate and reproducible cohesiveness measurements.
- Sample handling: How the sample is prepared and handled prior to testing can affect its structure and, consequently, its cohesiveness.
Collecting alternative measurements
Compressing powdered samples – using Unconfined Yield Stress Rig
A known volume of powder can be compacted using the Unconfined Yield Stress Rig to a chosen force to create a ‘puck’ after which a compression test will measure the yield stress which is due the degree of cohesion of the sample.
 Unconfined Yield Stress Rig

TPA
A Texture Profile Analysis (TPA) test can measure cohesiveness amongst its parameters but this is from a compression test using a larger cylinder probe performing 2 compression cycles.
In the first compression cycle the probe applies force to the sample causing the sample to deform. The area under the curve of this first cycle indicates the amount of work required to compress the sample initially. After the probe releases the sample, it applies a second compression cycle. The area under the second curve reflects how much the sample resists further deformation after it has already been compressed once.
- Ratio of Areas: The cohesiveness value is determined by the ratio of the areas under the two curves. A value close to 1.0 indicates high cohesiveness, while a value closer to 0 indicates low cohesiveness.
- A high cohesive sample will have a second compression curve that is nearly as large as the first, showing that the sample didn’t break down much after the first compression.
- A low cohesive sample will have a much smaller second peak, indicating that the sample has broken down or failed to recover after the first compression, providing less resistance to the second.

Powder flow analysis
Using a Powder Flow Analyser attached to the Texture Analyser the cohesion of powders and granules can be measured in a more dynamic way.
 Powder Flow Analyser

Optimising cohesiveness measurement and analysis: The Stable Micro Systems advantage
The Stable Micro Systems Texture Analyser stands out in optimising cohesiveness measurements through its comprehensive approach and advanced features. It offers specialised attachments like the Powder Flow Analyser, enabling versatile testing across various materials, back extrusion measurements and a specially designed Texture Profile Analysis dual cycle test for food products.
The Texture Analyser's high-precision measurements and detailed Exponent Connect software provide accurate, repeatable results with in-depth force-distance-time profiles. Backed by Stable Micro Systems' expertise in method development and data interpretation, this Texture Analyser delivers unparalleled accuracy and insight in measuring cohesiveness.
These capabilities make it the optimal choice for researchers and manufacturers seeking to refine product textures and material properties across diverse applications, from food products to powders and granulated materials.
A choice of probes/attachments to test at micro-level accuracy in force and distance.
Precision analysis of curves collecting multiple parameters.
Ability to additionally measure Powder Flow and cohesion properties.
If you need help with your cohesion measurement, we offer unrivalled support.
If you need help with your abrasion measurement, we offer unrivalled support
Be guided through the steps to successful testing and analysis of cohesion.